

Navigating the initial public offering (IPO) market can feel like buying a lottery ticket. You study the company fundamentals, check the Grey Market Premium (GMP), fill out the application, block you’re hard earned money via ASBA, and then you get nothing. For most retail investors, the dreaded “We regret to inform you that your application was not selected for allotment” message is an all too familiar disappointment.
But what if IPO investing was not just a game of blind luck? What if you could use mathematics, regulatory guidelines, and subscription data to predict your chances before you even hit the “Submit” button?
That is exactly where an IPO allotment calculator comes into play. By leveraging live market demand and SEBI rules, you can move away from guesswork and strategically optimize your bidding approach. In this definitive guide, we will unpack how allotment probability works, break down the mathematical frameworks, and reveal data-backed strategies to maximize your chances of securing those coveted shares.
IPO Allotment Chance Calculator
IPO Allotment Calculator
Calculate your allotment probability and expected shares
How to Use This Calculator
Using our online IPO allotment prediction calculator is incredibly simple and takes less than a minute. To get an accurate estimation of your allotment probability, follow these simple inputs:
- Enter the Lot Size: Input the minimum no of shares that make up one lot for the specific IPO.
- Enter Your Applied Lots: Specify how many lots you intend to apply for (or have already applied for).
- Input the Live Retail Subscription (Times): Check the live bidding data on stock exchanges (BSE/NSE) and enter how many times the retail individual investor (RII) category has been subscribed.
- Click Calculate Now: The tool will instantly process the SEBI lottery algorithms and display your allotment probability alongside your expected share allocation.
What is an IPO Allotment Chance Calculator and Why Every Investor Needs One
An IPO allotment Chance calculator is a digital analytical tool designed to estimate the statistical probability of an investor receiving shares in an upcoming initial public offering.
When a company goes public, it sets aside a exact percentage of shares for different categories of investors – Qualified Institutional Buyers (QIBs), Non-Institutional Investors (NIIs/HNIs), and Retail Individual Investors (RIIs). Because first-class IPOs are frequently oversubscribed by dozens or even hundreds of times, the demand grossly outstrips the supply.
Why Every Smart Investor Needs This Tool:
- Eliminates Emotional Bidding: Instead of over-applying blindly across multiple accounts without a plan, it gives you raw, unbiased data.
- Capital Efficiency: If the calculator shows that applying for 10 lots in a single retail account yields the exact same probability as applying for 1 lot, you can free up your blocked capital for other financial opportunities or other concurrent IPOs.
- Strategic Mapping: It helps you decide whether you should apply through the Retail category or split your funds to enter the Small HNI (sNII) category for a higher mathematical advantage.
How to Calculate IPO Allotment Chances: The Complete SEBI Framework
To understand how an IPO allotment chance calculator works, one must first understand the legal guidelines laid down by the Securities and Exchange Board of India (SEBI).
Historically, companies distributed shares proportionately. If an IPO was oversubscribed 10 times, an investor who applied for 10 lots got 1 lot. However, this system heavily favored ultra-wealthy investors and left small retail participants empty-handed.
To level the playing field, SEBI completely revamped the retail allotment framework. The modern SEBI objective is simple: Maximize the number of unique retail applicants who receive at least the minimum bid lot.
The Retail Category Rules:
- The Minimum Allotment Rule: SEBI mandates that the total number of available retail shares be divided by the minimum lot size. This determines the maximum number of unique retail investors who can possibly get an allotment.
- The Equal Footing Mandate: Whether you apply for 1 lot (worth roughly ₹15,000) or maximum 13–14 lots (up to ₹2 Lakhs), every unique applicant is treated as a single entry in the system if the IPO is oversubscribed.
How Does IPO Allotment Chance Calculator Work: The Mathematical Framework
When an IPO faces massive public interest, an IPO oversubscription calculator uses a probability formula to simulate SEBI randomized computerized lottery.
Let’s look under the hood of the mathematical equations governing your allotment chances.
Scenario A: When the IPO is Under-Subscribed (Subscription<1)
If the total number of applications is less than or equal to the total shares reserved for retail investors, the probability is absolute:
Allotment Probability = 100%
Allocated Shares = Shares Applied
Scenario B: When the IPO is Over-Subscribed (Subscription > 1)
When demand crosses supply, the system switches entirely to a lottery. Your number of applied lots no longer increases your chance per account. The mathematical formula becomes:
Allotment Probability = (1\Retail Subscription Times) X 100%

For example, if a high-profile tech IPO sees its retail portion subscribed 50 times, your math looks like this:
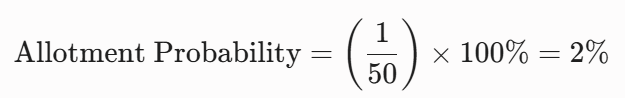
Regardless of whether you bid for 1 lot or 13 lots in that specific account, your chance of being drawn in the lottery remains a mere 2%. If selected, you will be granted exactly 1 minimum lot, and the money for the remaining lots will be refunded to your bank account.
IPO Oversubscription Calculator: Predicting Market Demand
Subscription data changes rapidly across the 3 to 4 days an IPO remains open. An IPO oversubscription calculator tracks this velocity.
By observing the retail subscription impact on allotment, investors can watch the subscription speed on Day 1 and Day 2 to project the final subscription numbers on Day 3.
- Low Subscription (1x to 3x): High probability of allotment. This is common in fundamentally stable but unhyped companies.
- Medium Subscription (3x to 15x): Moderate lottery odds. Strategy adjustments can still yield great results here.
- Massive Hyper-Subscription (50x to 100x+): Pure lottery territory. Your chances drop to less than 1-2%. In such cases, spreading applications across different PAN cards becomes mandatory to preserve statistical upside.
Complete IPO Allotment Chance Calculation Table
To give you a clear, bird’s-eye view of how different subscription levels directly compress your odds, we compiled this structural projection matrix:
| Subscription Status | Retail Subscription (Times) | Allotment Probability Per PAN | Max Shares Allotted If Selected | Capital Efficiency Rating |
|---|---|---|---|---|
| Under-subscribed | 0.5x | 100% | Full Application Value | Excellent |
| Fully Subscribed | 1.0x | 100% | Full Application Value | Excellent |
| Mildly Oversubscribed | 2.0x | 50.00% | 1 Minimum Lot | High |
| Moderately Oversubscribed | 5.0x | 20.00% | 1 Minimum Lot | Medium |
| Highly Oversubscribed | 10.0x | 10.00% | 1 Minimum Lot | Low (If bidding multiple lots) |
| Very Highly Oversubscribed | 25.0x | 4.00% | 1 Minimum Lot | Very Low |
| Mega Blockbuster | 100.0x | 1.00% | 1 Minimum Lot | Critically Low |
IPO Allotment Prediction Calculator: Advanced Probability Models
While basic tools use a simplistic inverse formula, an advanced IPO allotment prediction calculator factors in real-world nuances. These include invalid/rejected applications and unexecuted mandates. On average, between 3% to 8% of all retail IPO applications get technically rejected due to mismatched UPI IDs, incorrect PAN details, or duplicate applications. Advanced calculators deduct these structural anomalies from the total subscription pool. This slightly adjusts your true probability higher than the raw public exchange figures suggest.
What Affects IPO Allotment Probability: 7 Critical Factors
Understanding the variables that influence your odds will transform the way you interact with the share market.
- Total Retail Category Sizing: Companies choose how much to allocate to retail. Mainboard IPOs usually allocate 35% of their total issue size to retail, but if the company is loss-making, SEBI forces them to cap the retail quota at just 10%. A smaller pool drastically slashes your chances.
- Retail Subscription Times: The single largest factor. As the total number of retail bids climbs, your individual mathematical probability shrinks proportionally.
- Price Bidding Strategy (Cut-off Price): If you do not select the “Cut-off Price” option, and instead bid at the lower end of the price band, your application is immediately discarded if the IPO prices at the ceiling.
- Technical Accuracy of Application: Mismatched names between your bank account and your Demat account, or failing to approve the UPI autopay mandate before the deadline, will disqualify your bid instantly.
- Number of Unique Demat Accounts (PAN Cards): Since SEBI treats one PAN card as one entry, applying multiple times from a single PAN card guarantees rejection. Conversely, applying from multiple family members’ PAN cards scales your odds linearly.
- Investor Category Selection: Choosing between Retail ($<\text{₹}2,00,000$), Small HNI ($\text{₹}2,00,000$ to $\text{₹}10,00,000$), or Shareholder/Employee quotas alters your competitive pool.
- Market Sentiment and GMP: High Grey Market Premiums act like a magnet, drawing in millions of casual applicants on the final day, causing subscription numbers to skyrocket and allotment chances to plunge.
How to Calculate IPO Allotment Chances: Practical Step-by-Step Method
If you want to manually cross-verify or check IPO allotment probability, you can use this practical manual method:
Step 1: Find the Net Offer to Public (Retail Share Count)
Look up the IPO Prospectus (RHP) or a stock portal to find out exactly how many shares are specifically reserved for Retail Individual Investors (N).
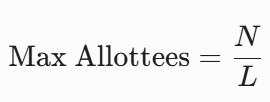
Step 2: Determine the Maximum Retail Allottees
Divide the total retail shares (N) by the defined Minimum Lot Size (L).
Max Allottees = N/L
Step 3: Compare with Total Valid Applications
Find the total number of unique valid applications received (A). If A is greater than the Max Allottees, a lottery happens. Your mathematical probability is:
Chance = Max Allottees / A

IPO Allotment Ratio Calculator: Understanding Proportionate Distribution
While the retail category runs purely on a computerized lottery system, the Non-Institutional Investor (NII / HNI) category operates differently. Knowing this difference helps you deploy your capital appropriately.
The NII category is split into two distinct sub-segments:
- Small HNI (sNII): Applications ranging from ₹2 Lakh to ₹10 Lakh.
- Big HNI (bNII): Applications above ₹10 Lakh.
The NII Lottery Allotment System:
Following recent SEBI revisions, the NII category also works on a lottery basis. However, instead of a minimum retail lot, the minimum allotment size for the NII category is fixed at a value equivalent to just above ₹2 Lakhs (known as the Minimum HNI Lot).
If the sNII segment is oversubscribed 20 times, a lottery is drawn. Successful winners don’t get their full applied amount; instead, they receive the base HNI lot worth ₹2 Lakhs. An IPO allotment ratio calculator helps HNIs determine whether it makes sense to bid minimum lots across multiple HNI accounts or concentrate capital.
Advanced IPO Calculator Tools: Feature Comparison
Not all investment calculators are built equal. When choosing or utilizing tools to optimize your stock portfolio, it helps to understand what features to look out for:
| Feature Available | Basic Allotment Calculators | Advanced Probability Calculators |
|---|---|---|
| Lot Size Multipliers | Yes | Yes |
| Live Subscription Sync | No (Manual Input) | Yes (Automated Exchange Feeds) |
| Technical Rejection Factor | No | Yes (Applies 5% historical buffer) |
| HNI / Shareholder Quota Support | No | Yes |
| Capital Optimization Suggestion | No | Yes |
Strategic IPO Application Framework Using Allotment Calculators
Now that you possess the mathematical tools, let’s explore how to increase IPO allotment chances using a structured operational framework.
1. Execute the Multi-PAN Strategy
Because SEBI limits oversubscribed retail rewards to a single lot per individual, applying for 14 lots from one Demat account is highly inefficient. Instead, divide that capital. Open Demat accounts for your parents, spouse, or siblings. Applying for 1 lot across 5 unique PAN cards multiplies your mathematical chance of winning the lottery by 5x (500%).
2. Always Bid at the Cut-off Price
The price band of an IPO has a floor and a cap (e.g., ₹500 to ₹525). High-quality IPOs always price at the absolute ceiling (₹525). If you manually lock your bid at ₹520 to save money, your application is structurally eliminated before the lottery even begins. Selecting the “Cut-off Price” checkbox ensures your application stays valid at the final discovered price.
3. Leverage the Shareholder Quota Advantage
If you are a retail investor who happens to own even a single share of a parent/holding company listing its subsidiary (e.g., owning Tata Motors before the Tata Technologies IPO), you qualify for the Shareholder Quota. The subscription pressure in the shareholder category is usually much lower than the general public category, dramatically boosting your allotment probability.
Common Mistakes Investors Make Without Using Calculators
- The “Max Lot” Trap: Spending ₹2 Lakhs in a single retail account on a mega-popular IPO that is oversubscribed 100 times. You waste liquidity for days, only to get 1 lot at best or nothing at all.
- Duplicate Applications: Applying via two different brokers (like Zerodha and Groww) using the same PAN card. The exchange algorithms catch this instantly and blacklist both applications.
- Late UPI Mandate Approvals: Submitting the application on the broker portal but delaying the UPI fund block mandate until after the official banking cutoff time (usually 5:00 PM on closing day).
Real-World IPO Allotment Case Studies
Case Study 1: The Hyper-Hyped Tech IPO (Tata Technologies IPO)
When Tata Technologies hit the primary markets, retail excitement reached a fever pitch. The retail portion ended up heavily oversubscribed. Investors who applied for the full 13 lots in a single account received either 0 or exactly 1 lot.
Conversely, strategic investors who used an IPO oversubscription calculator realized early that the probability per account was low. They split their funds to apply for 1 lot across 6 family accounts. Statistically, this diversified footprint resulted in a massive structural advantage, and many walked away with multiple successful allocations.
Case Study 2: The Under-the-Radar SME IPO
Small and Medium Enterprise (SME) IPOs have high minimum application lots (usually around ₹1 Lakh to ₹1.4 Lakh). Because the entry barrier is high, retail subscription numbers can sometimes remain low during early days. Investors using real-time data calculators can identify when an issue remains moderately subscribed, allowing them to apply confidently for certain, predictable allocations.
Regulatory Compliance and Calculator Accuracy
While an online IPO allotment prediction calculator uses highly accurate mathematical models and real-time exchange data, investors must remember that it calculates probabilistic distribution.
Because the final step relies on a randomized computer lottery handled by the designated registrar (such as Link Intime or KFin Technologies), a 40% probability score does not guarantee you will win 4 out of 10 times. It means every single individual application has a 40% independent chance of success inside the registrar’s digital drawing urn.
FAQs about IPO Allotment Chance Calculator
Does applying early on Day 1 increase my IPO allotment chances?
No. This is a widespread myth. Whether you apply within the first minute of Day 1 or the last minute of Day 3, SEBI’s framework treats all valid applications equally. The randomized lottery runs only after the issue closes completely.
Can I apply for an IPO using a corporate bank account and a personal Demat?
No. The primary PAN on the bank account used for the ASBA/UPI payment must match the PAN registered on the Demat account. Any mismatch leads to automatic technical rejection.
What happens to my blocked money if I do not get an allotment?
Your money never leaves your bank account during the application phase; it is simply held via an ASBA/UPI block. If the calculator predicts failure and you don’t get an allotment, the registrar sends a release command to your bank, and the funds are unblocked/refunded within 1 to 2 working days after the allotment date.
Is it better to apply via the Retail or Small HNI category?
It depends entirely on the live subscription ratios shown by your IPO allotment calculator. If the retail category is subscribed 80x but the Small HNI category is subscribed only 10x, deploying ₹2 Lakh+ to enter the Small HNI segment can offer a much stronger mathematical probability of success.
How do I check my final actual allotment status online?
Once the allocation process concludes, you can check your definitive status by visiting the official website of the IPO registrar (e.g., KFintech or Link Intime) and entering your PAN Number, Application Number, or DP ID.
Disclaimer: The information provided on Equitylogy is for educational and informational purposes only and should not be construed as professional financial, legal, or investment advice.
A Complete IPO Upcoming list of 2026 – Upcoming IPO 2026