
FINNIFTY: Are you looking for accurate Finifty forecast to deal with the volatile financial sector today? Whether you are an intraday trader or a long-term investor, it is important to understand the movements of the Nifty Financial Services Index. In this guide, we provide in-depth information on today market forecast, technical charts, live insights & expert opinions to help you trade with confidence.
Finnifty Today: Market Overview and Current Trends
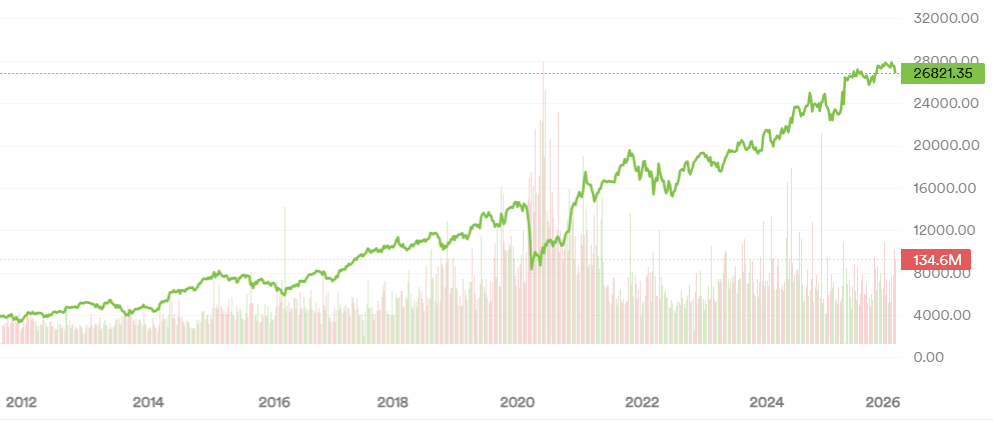
The Nifty Financial Services Index (FINNIFTY) tracks the performance of the top 20 companies in India financial sector, including banking, insurance, NBFCs and housing finance.
FINNIFTY Performance
| Date | FinNifty Today |
|---|---|
| 03-Feb-2026 | 27,749 |
Markets Today
| High | 28,275 | Low | 26,463.15 |
| Open | 28,125 | Prev Close | 26,795 |
FinNifty Range: 26,463.15-282798.05
Read also about Bank Nifty
Historical Performance
| 3 Month High | 28,275 | 3 Month Low | 26,368 |
| 1 Year High | 28,275 | 1 Year Low | 22,819 |
| 3 Year High | 28,275 | 3 Year Low | 17,261 |
| 5 Year High | 28,275 | 5 Year Low | 14,600 |
FINNIFTY Sector Weightage
| Sectors | Companies | Weightage | Market Cap (in Cr.) |
|---|---|---|---|
| Banks | 5 | 62.39% | 41,31,270.06 |
| Financial Services | 10 | 27.85% | 18,44,263.39 |
| Insurance | 4 | 8.10% | 5,36,354.26 |
| Capital Markets | 1 | 1.65% | 1,09,533.19 |
According to the latest market data, Finifty Live price is hovering around 26,821.35, indicating a recent decline of about 1.21%. Market sentiment is currently cautious, with a “sell on rise” structure observed across key timeframes. Biggies like HDFC Bank and ICICI Bank are playing an important role in deciding the direction of the index.
Finnifty Forecast Today: Support and Resistance Levels
Technical analysis is the backbone of any today market prediction for intraday. Based on the current finnifty chart and derivative data, here are the key levels to watch:
Finnifty Intraday Trading Levels – 03-02-2026
| Level | FinNifty Support | FinNifty Resistance |
|---|---|---|
| Level 1 | 26,561 | 26,940 |
| Level 2 | 26,322 | 27,081 |
| Level 3 | 26,181 | 27,320 |
Traders should keep a close eye on the today market prediction live updates, especially during the first hour of trade, as the opening gap often sets the tone for the day.
FinNifty Prediction for Tomorrow: What to Expect?
Looking ahead, the finnifty prediction for tomorrow depends largely on the closing price today. Experts suggest that if the index fails to hold the 26,800 level, we might see a bearish continuation. Conversely, a strong recovery in private banking stocks could lead to a relief rally.
Many traders use finnifty tomorrow prediction TradingView setups to identify Demand and Supply zones. Currently, the daily RSI (Relative Strength Index) is slipping toward 40, suggesting that while the momentum is weak, the index is approaching oversold territory, which might attract some buying interest at lower levels.
Nifty Prediction for Tomorrow: Expert Market View
The current market sentiment is influenced by a rising India VIX (at 14.36), indicating a sharp 7.5% jump in volatility. This “fear gauge” makes the financial sector particularly sensitive to global news and institutional selling.
Expert Analysis & Trading Targets
| Condition / Trigger Level | Targeted Price Levels | Market Sentiment |
|---|---|---|
| If Index trades below 26,600 | 26,400 — 26,250 | 🔴 Bearish View |
| Decisive close above 27,300 | 27,550 — 27,700 | 🟢 Bullish View |
| Trading between 26,650 – 27,150 | Range-bound | 🟡 Neutral/Sideways |
FINNIFTY Annually & Monthly Returns Data for last 6 Months (Historical Returns)
| Year | Jan | Feb | Mar | Apr | May | Jun | Jul | Aug | Sep | Oct | Nov | Dec | Annually |
| 2026 | -2.87% | NA | NA | NA | NA | NA | NA | NA | NA | NA | NA | NA | -2.87% |
| 2025 | -1.24% | -0.8% | 8.88% | 4.14% | 1.48% | 2.55% | -1.93% | -4.06% | 1.78% | 4.29% | 2.77% | -0.99% | 17.44% |
| 2024 | -4.61% | -0.4% | 2.85% | 4.06% | -0.56% | 7.84% | -0.03% | 0.96% | 3.56% | -2.43% | 0.52% | -2.07% | 9.43% |
| 2023 | -4.67% | -0.58% | 0.38% | 6.11% | 1.48% | 3.15% | 1.42% | -3.66% | 1.09% | -3.06% | 4.43% | 7.14% | 13.20% |
| 2022 | 2.92% | -5.05% | 1.24% | -2.98% | -0.97% | -6.08% | 12.69% | 4.57% | -3.99% | 5.89% | 4.43% | -1.95% | 9.52% |
| 2021 | 4.04% | 10.2% | -2.3% | -.99% | 7.09% | -1.32% | 0.15% | 9.73% | 1.29% | 2.67% | -6.69% | -1.16% | 13.96% |
| 2020 | -1.65% | -5.24% | -31.3% | 13.45% | -9.87% | 10.86% | 1.58% | 6.15% | -6.73% | 9.54% | 22.84% | 6.40% | 4.47% |
| 2019 | -1.12% | -2.0% | 11.7% | 0.09% | 7.36% | 0.57% | -6.26% | -2.28% | 4.82% | 3.83% | 5.12% | 2.45% | 25.65% |
| 2018 | 7.51% | -7.3% | -2.2% | 4.59% | 4.27% | -1.12% | 5.96% | 0.48% | -9.74% | 0.59% | 7.51% | 1.29% | 10.60% |
| 2017 | 6.89% | 4.67% | 5.4% | 3.80% | 4.90% | -0.17% | 8.16% | -1.66% | -1.58% | 2.98% | 0.87% | 1.46% | 41.42% |
Why Track Finnifty Live?
Monitoring the finnifty live data is essential for option traders. Since Finnifty has its own expiry cycle, the Max Pain and Open Interest data shift rapidly. High OI build-up at 27,000 Call and 26,500 Put indicates a possible trading range for the current expiry.
Key Factors Influencing Today Market:
- FII & DII Activity:
- Sector Weightage:
- Global Cues:
FAQs about FinNifty Forecast Today
What is the Finnifty forecast today?
Today forecast remains sideways to bearish, with major resistance at 28,355 & support at 26,236.
Where can I find the finnifty live chart?
You can access the live chart on platforms like TradingView, Dhan, or Groww for real-time technical analysis.
Is Nifty Financial Services good for intraday?
Yes, due to its liquidity and the presence of high-beta stocks like Axis Bank and Bajaj Finance, it is a favorite for intraday traders.